
Reading Media Volume (声量): What a Mention Count Does and Does Not Tell You
Mention volume, called 声量 in Chinese media monitoring, looks like a plain count. Five choices decide its value, and the same two weeks can be +50%, +23% or no change, depending on how you count.
Synthetic dataExamples on this page use synthetic data created for illustration.
On this page
“Mentions of our brand are up 50% this week.” It is one of the most common sentences in media monitoring, and one of the least informative until you know how the count was made. In Chinese-language monitoring the idea is called 声量 (shēngliàng), literally “the volume of voices”; in English, mention volume, or buzz. The number is real, but it is a measurement with settings, and the settings decide the answer.
The five settings behind every count
1. What is a mention? One article that names the brand, every occurrence inside the article, or one story however many places carry it? Ten articles and a hundred occurrences are different volumes of the same coverage.
2. Which words find it? The brand name, its abbreviations, its old name, its common misspellings, the names of its products, in every language you care about. And what about names that belong to something else? A search for “Apple” finds fruit and phone stories alike. Each choice moves the count, and a recogniser that links names to the right company is a project in itself (Named Entity Recognition).
3. Which sources? A hundred news sites, a thousand blogs, social posts, or all of them? Adding sources raises volume without anything having happened in the world.
4. Which period, in which time zone? “Monday” begins and ends at different moments in Tokyo and Los Angeles. A story published at 23:30 UTC is on Tuesday in Tokyo and on Monday in Los Angeles, so a daily count depends on the zone (UTC and Time Zones).
5. How are copies counted? A news agency story run by forty newspapers is one story or forty-one mentions, depending on your answer (Syndicated Content).
A volume number is only meaningful together with all five. Two dashboards that disagree may simply have chosen differently.
One pair of weeks, three answers
Take an invented brand, Acme. Week 1: 120 mentions from 20 sources, of which 6 are copies of other stories, leaving 114 unique stories. Week 2: 180 mentions from 30 sources (the monitoring team added 10 new sources in between), including 40 copies of a single agency story, leaving 140 unique stories, of which 28 come from the new sources.
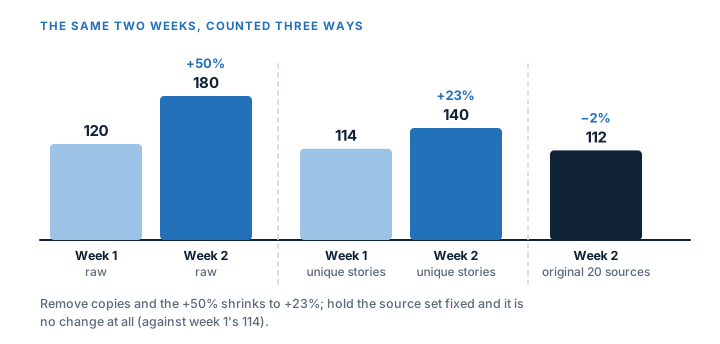
| Way of counting | Week 1 | Week 2 | Change |
|---|---|---|---|
| Raw mentions | 120 | 180 | +50% |
| Unique stories (copies removed) | 114 | 140 | +23% |
| Unique stories from the original 20 sources | 114 | 112 | −2% |
The first line says coverage exploded. The second says it grew by a fifth. The third, the only like-for-like comparison, says nothing changed. All three counts are accurate; they answer different questions, and only one answers “is Acme being talked about more by the same sources?”.
What volume is not
Volume is not attention. A mention may be read by ten people or ten million. If you need reach, count it separately from mentions, and do not multiply the two without saying how.
Volume is not importance. A single article in the one outlet that decision-makers read may matter more than a hundred reposts. Weighting by source is possible, but it is a judgment that has to be written down.
Volume is not sentiment. Mentions can rise because of good news or bad. A volume chart by itself does not tell you which (Sentiment Analysis, with its own limits).
Volume is not the whole conversation. It counts what the collected sources said. It is not a sample of the public: the people who write are not the people who read, and the sources are chosen by you.
Making it comparable
- Hold the source list fixed, or compute the count separately for the original list and the additions, as above.
- Count stories, not copies, and report copies as a separate number (Near-duplicate Detection).
- Use shares when the total moves. Share of voice divides a brand’s mentions by all mentions of the comparison set, so it is not fooled by a general rise in the total, but it depends on who is in the set (Share of Voice).
- Compare against a baseline, not against zero. Volume has weekly rhythms (weekdays are busier), so compare a Tuesday with Tuesdays.
- Check spikes before you report them. A sudden jump is often a copy cascade, a bot, an outage that repeated data, or a change in collection. Look at the biggest cluster of stories before the explanation.
What to report with the number
A volume figure should travel with a short definition, so that anyone can reproduce or challenge it:
Unique stories mentioning Acme (name, ticker and two product names, English), found in the 20 original sources, counted per week by UTC publication date, with near-duplicates grouped into one story.
That sentence takes a few seconds to write and rules out most misunderstandings. If the definition changes (a source is added, the query is widened), say so and start a new series rather than splicing the old and new together.
A note on terms
The terms volume, buzz, 声量, 热度 and discussion volume are used loosely and are not standardised. Some tools mean unique articles, some mean posts, some mix in engagement. When you read someone else’s number, ask which of the five settings they chose; when you publish your own, state them.
References
- Matthew Gentzkow, Bryan Kelly, Matt Taddy. Text as Data . Journal of Economic Literature, 2019. DOI: 10.1257/jel.20181020
- Klaus Krippendorff. Content Analysis: An Introduction to Its Methodology . SAGE Publications, 2018. ISBN 978-1412983150.
- Thomas Eisensee, David Strömberg. News Droughts, News Floods, and U.S. Disaster Relief . The Quarterly Journal of Economics, 2007. DOI: 10.1162/qjec.122.2.693