
Data Lineage and Traceability: How to Tell Whether a Number Can Be Trusted
A number does not carry its own credibility. Three questions about where it came from, what was done to it and what depends on it let you judge it.
Synthetic dataExamples on this page use synthetic data created for illustration.
On this page
A figure in a report looks the same whether it is solid or shaky. “Monthly revenue: 42.7” gives no hint of how it was made. Trust has to come from somewhere other than the number itself, and the usual source is its history.
Three questions for any figure
Data Lineage is the record of that history. It answers three questions:
- Where did it come from? The original sources, and when they were retrieved.
- What was done to it? Every filter, join, correction and calculation between source and report.
- What depends on it? The charts, models and decisions built on top.
The first two tell you whether to trust the figure. The third tells you what to re-check when something upstream changes.
The same label, two numbers
The example below is synthetic. Two teams both report “monthly revenue” for March.
| Team A | Team B | |
|---|---|---|
| Source | Payments export, retrieved Apr 3 | Payments export, retrieved Apr 20 |
| Refunds | Removed | Included |
| Currency conversion | Monthly average rate | Month-end rate |
| Reported figure | 42.7 | 45.1 |
Neither team is wrong. They answered slightly different questions under the same name. Without the recipe beside the number, a reader cannot tell, and an argument about “whose number is right” can run for days.
Tracing one figure end to end
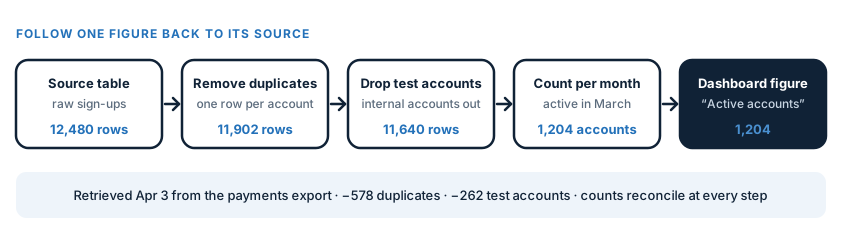
Take the dashboard figure “Active accounts: 1,204” and walk it back. At each step ask one question and look for one kind of evidence.
| Step | What to ask | What good evidence looks like |
|---|---|---|
| The figure on the report | Which definition produced it? | A named, versioned definition that anyone can read |
| The aggregation | Which rows were counted, which were left out? | The inclusion and exclusion rules, written down |
| The cleaning step | What was dropped, and how many rows? | Row counts before and after that reconcile |
| The extract | Where from, when, and in which version? | A source identifier and a retrieval timestamp |
| The original system | Who owns it, and what can change in it? | A named owner and a change log |
A good trace ends at a source that someone can name, with a date, and with counts that add up at every step. If any step is “I think it came from somewhere in the warehouse”, the trace has a hole, and the figure is only as strong as that hole allows.
Lineage is not quality
A documented path shows how a figure was made, not that it is correct. If the filter was wrong, perfect lineage will faithfully show the wrong filter. That is still valuable, because it turns a mystery into something you can inspect, but do not mistake traceable for true.
Habits that work without any tooling
- Write the one-line recipe next to every number: source, retrieval date, main steps, unit.
- Keep raw inputs untouched. Do the transformations in separate, named steps, so any step can be rerun.
- Record when data was retrieved, not only what period it covers. Sources get revised; see Bitemporal Data for why this matters.
- Version the transformation rules, so a change in method is visible as a change.
- Re-derive one figure from scratch, regularly. If you cannot, the lineage is a story, not a record.
When tooling helps
Manual notes stop scaling as the number of steps grows. Open standards such as OpenLineage describe how pipeline tools can report what they read and write, so the lineage is captured as a by-product of running the work rather than drawn afterwards by hand. A lineage diagram that nobody updates is worse than none, because it looks authoritative.
Questions to ask when someone hands you a number
- Which definition is this, and where is it written?
- When was the source data retrieved, and could it have been revised since?
- What was removed on the way, and how many rows?
- Who would notice if this figure were wrong?
- Can you reproduce it from the raw input today?
These take a minute to ask. The answers, or the silence after them, tell you most of what you need.
Red flags
- A figure with no stated source or date.
- “We always do it that way” as the explanation of a step.
- Two reports using one name for different calculations.
- Inputs that were overwritten, so the earlier result cannot be reproduced.
- A pipeline where nobody can say which outputs would change if one input did.
In short
Ask where it came from, what was done to it and what depends on it. If those three answers are written down, the number has earned a hearing. If they are not, treat it as a rumor.
References
- OpenLineage . LF AI & Data Foundation.
- PROV-Overview: An Overview of the PROV Family of Documents . W3C, 2013.